
Liquidation levels, often overlooked in the analysis of Bitcoin heatmaps, play a crucial role in shaping market dynamics. Understanding these levels can provide traders with a clear picture of potential price movements and risks. With 2026 approaching, the implications of these insights could significantly alter trading strategies and decision-making in the crypto space.
What is a BTC Heatmap?
BTC heatmaps are visual tools that represent market data concerning Bitcoin (BTC) price movements and trading volumes. They utilize colors and gradients to differentiate various price levels, allowing traders to quickly identify areas of significant trading activity.
Often, these visualizations highlight zones of buying and selling pressure, providing insights into potential support and resistance levels. For instance, darker shades may indicate high liquidity, while lighter areas might suggest lower trading interest.
Traders frequently use BTC heatmaps to inform their strategies. By observing the patterns displayed, they can anticipate where significant price movements might occur. This can lead to more informed trading decisions, particularly during volatile market conditions.
Heatmaps can also integrate on-chain data, enhancing their effectiveness by showing wallet movements or miner activities. This additional layer allows for deeper market analysis, revealing trends that purely price-based charts may miss. BTC heatmaps are essential for traders seeking to work through the complex landscape of cryptocurrency markets. They transform raw data into visual insights, aiding in decision-making and strategy formulation.
Common Misconceptions About BTC Heatmaps
-
Heatmaps Only Show Price Movements. Many believe BTC heatmaps solely indicate price changes, but they also display liquidity levels and market sentiment. This additional context helps traders understand where buying and selling pressure lies.
-
They Are Only Useful for Day Traders. While day traders frequently utilize heatmaps for quick decisions, these tools are also valuable for long-term investors. They can inform strategic entry and exit points by highlighting significant market zones over time.
-
Liquidation Levels Are Static. A common misunderstanding is that liquidation levels remain unchanged. In reality, they fluctuate based on market activity and trader behavior. As positions are opened and closed, these levels can shift, impacting potential liquidations.
These clarifications emphasize that BTC heatmaps are versatile tools, serving various trading strategies and adapting to market dynamics. Understanding their true functionality enhances their utility for all traders.
The Role of Liquidation Levels in Trading
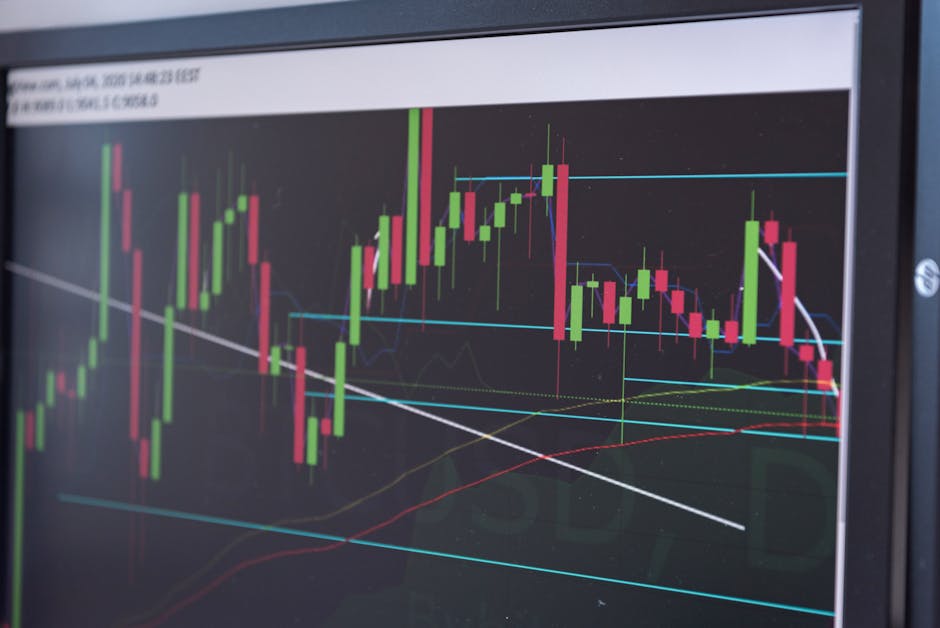
What role do liquidation levels play in trading strategies? Liquidation levels are crucial indicators in the cryptocurrency market, representing points at which leveraged positions are forcibly closed due to losses. Understanding these levels can provide traders with valuable insights into market behavior and potential price movements.
Liquidation levels are often depicted visually on a BTC heatmap, where colors indicate the intensity of liquidations across different price points. For instance, areas marked in red may signify high liquidation risks, while green areas could suggest stability. These visual cues help traders identify critical zones where market volatility might spike, leading to significant price shifts.
Traders frequently adjust their strategies based on these heatmaps. For example, if a trader notices a concentration of liquidations at a specific price level, they might decide to place trades just above or below that threshold in anticipation of price rebounds or drops. This approach can enhance the probability of success in volatile markets.
One noteworthy observation is that liquidation events often trigger rapid price movements. In the past, significant spikes in liquidation levels have led to cascading sell-offs, pushing prices further down before a rebound occurs. Traders who can accurately read these signals can capitalize on quick market shifts, positioning themselves favorably amidst the chaos.
The integration of on-chain metrics with heatmap data can raise the analysis even further. By overlaying wallet movements or miner activity, traders gain a richer understanding of market dynamics. This sophisticated approach not only aids in identifying risks but also in predicting future market behaviors, enhancing overall trading effectiveness.
Recent analysis shows that during a major liquidation event in 2021, over $4 billion in positions were liquidated within hours, illustrating the impact of these levels on market stability.
[IMAGE_SLOT_1]
Practical Application: Analyzing a BTC Heatmap Case Study
A BTC heatmap is a visual tool that traders use to analyze price action and liquidity in the Bitcoin market. By examining the heatmap, they can identify critical areas of support and resistance, enabling informed trading decisions. Here are several real-world applications demonstrating how traders utilize BTC heatmaps effectively:
-
Identifying Support and Resistance Levels. Traders often use BTC heatmaps to pinpoint where significant buying and selling pressure exists. For instance, if a heatmap shows a cluster of buy orders at a specific price point, traders may consider this a strong support level to enter a position.
-
Timing Entry and Exit Points. Heatmaps can reveal when to buy or sell based on market dynamics. For example, if a heatmap indicates a sudden spike in selling pressure, traders might decide to sell before the price drops further, thereby safeguarding profits.
-
Analyzing Market Sentiment. A heatmap can help traders gauge overall market sentiment. If many traders are placing buy orders at a certain level, it may indicate bullish sentiment, prompting more investors to enter the market. Conversely, heavy selling can signal bearish trends.
-
Spotting Liquidation Zones. By examining heatmaps, traders can identify potential liquidation points where significant positions might be forced to close. This awareness allows them to strategize their trades more effectively, aiming to avoid getting caught in sudden price drops.
-
Utilizing Historical Data. Traders frequently analyze historical heatmap data to recognize patterns and behaviors during previous market movements. For example, if past data shows that prices responded similarly during specific heatmap patterns, traders can use this information to forecast potential future movements.
-
Incorporating On-Chain Metrics. A practical application involves overlaying on-chain data, such as miner activities or wallet movements, onto heatmaps. This integration can provide deeper insights, enabling traders to make better-informed decisions based on both market signals and blockchain activity.
-
Real-Time Monitoring. Traders can utilize real-time BTC heatmaps to react swiftly to market changes. For instance, during major news events, a heatmap can quickly reveal shifts in liquidity, allowing traders to adjust their positions accordingly for optimal gains. BTC heatmaps serve as valuable tools for traders by offering critical insights into market behavior and helping them formulate strategic trading approaches.
How to Read a BTC Heatmap Effectively
To effectively interpret a BTC heatmap, it’s essential to understand the visual representation of market data. BTC heatmaps display various metrics, including price levels, liquidity, and liquidation points, which help traders recognize potential market movements.
Key Elements of a BTC Heatmap
-
Color Coding. Colors represent different ranges of prices or volume, typically using gradients. For example, red may indicate high liquidation zones, while green could show areas of strong support. Understanding this color scheme is crucial for quick assessments.
-
Price Levels. The heatmap indicates specific price levels where significant trading activity occurs. Traders can identify where resistance or support may form based on these levels, aiding in their strategic decisions.
-
Volume Indicators. Heatmaps often integrate volume data, allowing traders to see where liquidity exists. High volume can indicate strong interest at certain price points, which may lead to increased volatility.
-
Liquidation Points. These points signify where traders may face forced liquidation due to margin calls. Recognizing these levels can help traders avoid traps or take advantage of potential price swings.
-
Timeframes. Different heatmaps may represent various timeframes, from minutes to days. Understanding the timeframe is vital; shorter intervals indicate rapid changes, while longer ones may highlight more stable trends.
By grasping these components, traders can better work through the complexities of the BTC market, leveraging heatmaps as valuable tools for informed decision-making.
Future Trends: The Evolution of BTC Heatmaps
The evolution of BTC heatmaps is set to redefine how traders interact with market data. As technology advances, these visual tools may incorporate real-time analytics, enhancing decision-making in trading environments. The future will likely see heatmaps integrating on-chain metrics, which could allow users to visualize wallet movements alongside price action, thereby providing deeper market insights.
Traders might also benefit from predictive analytics powered by machine learning. This technology could analyze historical heatmap data to predict potential liquidation events, offering a proactive approach to risk management. Additionally, user behavior insights may evolve, revealing trends in how different trader types interact with these tools, from retail investors to institutional players.
As these trends unfold, BTC heatmaps could become more sophisticated, offering tailored alerts based on market conditions, ultimately transforming them into essential tools for strategic trading. With this evolution, traders can expect a more dynamic approach to market analysis, positioning themselves better in the ever-changing landscape of cryptocurrency trading.